The web weaver for this site is Martin Stubbs
Please inform me of any sites which are not listed here or of any which are
out of date, or if you have any other comments.
Contact is via Martin Stubbs at the following e-mail address (substitute @
for #): mwstubbs#telco4u.co.uk
The Atmospheric and Climate Science Directorate
Access to a selection of products, but it is worth spending a little time browsing round the site itself since a large number of products are presented and the links below are only a small fraction of what is available. provides information for the less scientific minded. It is also worth having a browse through.
|
|
|
|
|
Surface Analysis for 00Z (with plotted observations) and a Surface Prognosis
for 12Z the following day
The following two DWD charts are available via the
Free University of Berlin
note that the (updated charts do not usually appear until after 10:00 GMT).
|
Entry page to the Wetter3 web site |
|||
|
|
|
|
|
|
|
|
|
|
|
|
|
|
|
|
|
|
||
UK Met Office products via the 'Wetter3' web site
|
|
|
|
|
|
|
|
|
|
|
|
Other DWD output via the Observatori Meteorològic de Sort
European Centre for Medium-Range Weather Forecasts, based in Reading, United Kingdom)
MSLP forecast menu for the world including the North
Atlantic and Europe (MSLP isobars and 850-hPa winds)
from the European Centre for Medium Range
Forecasts (ECMWF), Reading UK
|
|
ECMWF Output via Unisys Corp. USA:
ECMWF charts available on the Unisys site, 4-Panel (Day 3 to 6), Day 3, Day 4, Day 5, Day 6 Output via Infomet, Spain (mirror of charts on the Unisys Corp. site):Home page of the Instituto Nacional de Meteorología, Spain
Access to model output via menu options
Access to satellite imagery via menu options
Menu page to meteorological data and products
Menu for selection of upper-air data
Access to upper-air data provides the ability to view upper-air diagrams, hodographs, a text print-out of the data and calculated instability indices for each ascent
Menu for selection of METAR data world-wide
Advantage with this menu is that there is a facility to plot a meteogram of the observations
Menu for Difax charts
Charts (black and white) for most parts of the world originated by the NWS
Entry page for selecting numerical model output
Provides the user with choice of two sets of isopleths and two sets of colours to display the output
Model information from INFOMET,
University of Barcelona, Spain
|
|
|
products |
based on NCEP products |
A useful site but mainly oriented towards the North American
Continent
NCEP home page
AVN Run: 6-Panels Of Various Fields, T+12 to T+72 hours
Surface Pressure, 1000-500 hPa Thickness & Precipitation (via Unisys Corp., USA)
Info.
850 hPa Heights, Winds & Temperatures (via Unisys Corp., USA)
Info.
700 hPa Heights, Winds & Vertical Velocity (via Unisys Corp., USA)
Info.
500 hPa Heights, Winds & Absolute Vorticity (via Unisys Corp., USA)
Info.
300 hPa Heights & Winds (via Unisys Corp., USA)
Info.
Integrated 850-500 hPa Relative Humidity (via Unisys Corp., USA)
Info.
AVN Run: 4-Panels
850 hPa Temperature, 850 hPa Heights, 850 hPa Winds // 300 hPa Winds, 300 hPa Heights
Precipitation, Surface Pressure, Thickness // Integrated 850-500 hPa Relative Humidity, Showalter
Index
T+00,
T+12,
T+24,
T+36,
T+48,
T+60,
T+72
(via Unisys Corp., USA)
MRF Run: 9-Panels Of Various Fields, T+2 to T+10 days
Surface Pressure & 500 hPa Heights (via Unisys Corp., USA)
Info.
Surface Pressure, Precipitation & Thickness (via Unisys Corp., USA)
850 hPa Heights, Temperatures & Wind Speeds (via Unisys Corp., USA)
300 hPa Heights & Wind Speeds (via Unisys Corp., USA)
850-500 hPa Integrated Relative Humidity & Showalter Index (via Unisys Corp., USA)
MRF Run: Surface Pressure & 500 hPa Heights, for every 12 hours (T+0 to T+10 days)
T+00,
T+12,
T+24,
T+36,
T+48,
T+60,
T+72,
T+84,
T+96,
T+108,
T+120,
T+132,
T+144,
T+156,
T+168,
T+180,
T+192,
T+204,
T+216,
T+228,
T+240
(via Unisys Corp., USA)
MRF Run: 4-Panels, for every 12 hours (T+0 to T+10 days)
850 hPa Temperature, 850 hPa Heights, 850 hPa Winds // 300 hPa Winds, 300 hPa Heights
Precipitation, Surface Pressure, Thickness // Integrated 850-500 hPa Relative Humidity, Showalter
Index
T+00,
T+12,
T+24,
T+36,
T+48,
T+60,
T+72,
T+84,
T+96,
T+108,
T+120,
T+132,
T+144,
T+156,
T+168,
T+180,
T+192,
T+204,
T+216,
T+228,
T+240
(via Unisys Corp., USA)
Link to
the FNMOC public access site
|
Update 12th September 2009 |
|
Note that the T+84 is based on 0000UTC data and the T+96/120 on 1200UTC data |
|
PNG (75KB)
|
|
|
|
|
|
|
|
|
|
|
GIF (550KB)
|
|
|
|
|
|
|
|
|
|
|
TIF (55KB)
|
|
|
|
|
|
|
|
|
|
(Wise to always check the validity time
of the chart downloaded)
(All files are in TIF format (approx 55KB) while the LATEST
CHART is also available in both GIF (approx 550KB) and PNG (approx 75KB)
formats)
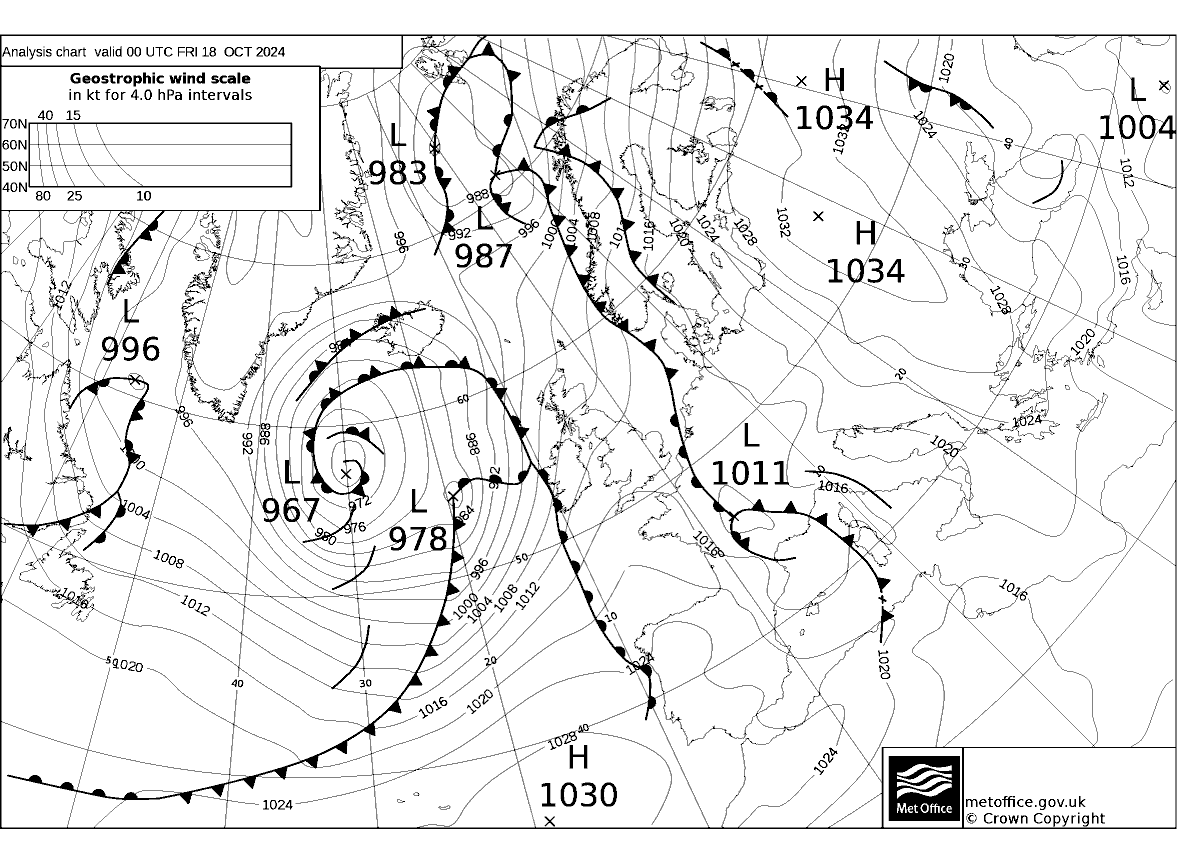
MSLP Analysis - ASXX (pressure centres,
fronts and isobars) for T+00 hours (North Atlantic & Europe)
0000
GMT (grabbed about 0305 GMT and again at 0505 GMT) 0600
GMT (grabbed about 0905 GMT and again at 1105 GMT)
1200 GMT
(grabbed about 1505 GMT and again at 1705 GMT) 1800
GMT (grabbed about 2105 GMT and again at 2305 GMT)
LATEST CHART: TIF
file format GIF
file format PNG
file format
Grabbed from: ftp://tgftp.nws.noaa.gov/fax/PPVA89.TIF
(via NWS, USA)
also available from http://weather.noaa.gov/pub/fax/PPVA89.TIF
(via NWS, USA) (except LATEST CHART in GIF & PNG formats which are
converted on-site)
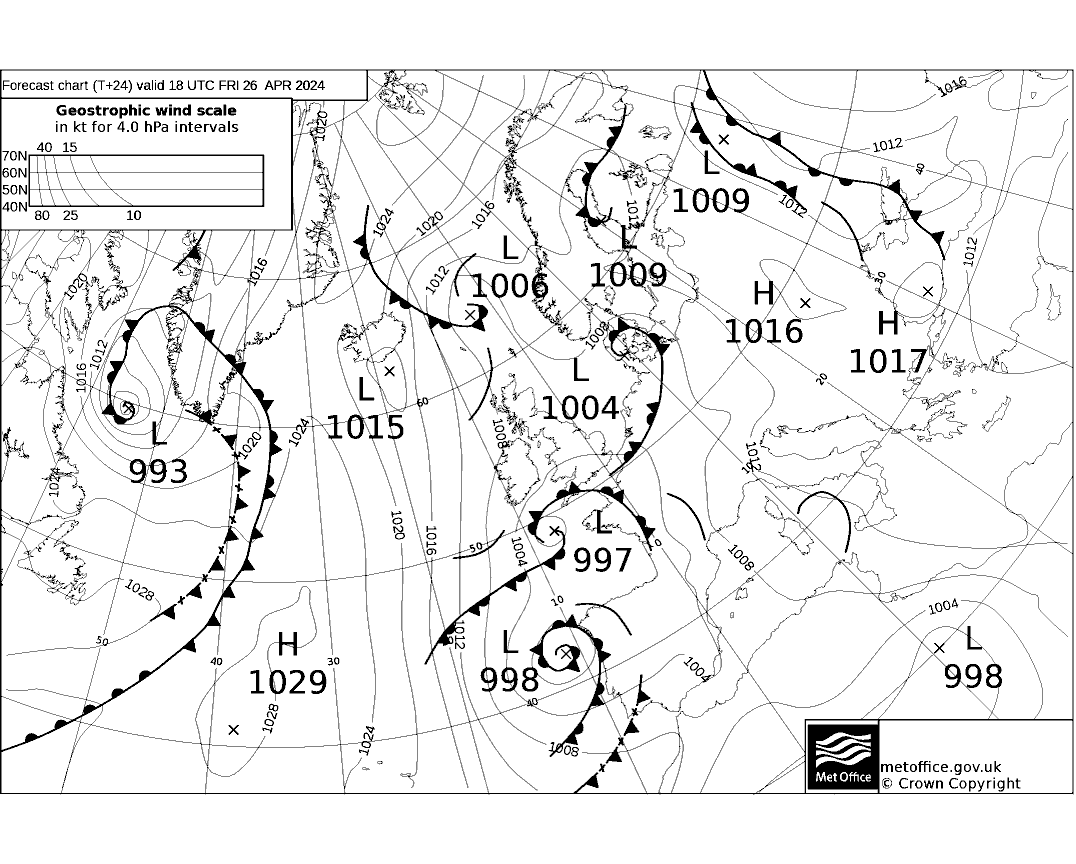
MSLP 24-hour forecast - FSXX (pressure
centres, fronts and isobars) (North Atlantic & Europe)
0000 GMT (grabbed about
0505 GMT and again at 0705 GMT) 0600
GMT (grabbed about 1105 GMT and again at 1305 GMT)
1200 GMT (grabbed about 1705 GMT and again
at 1905 GMT) 1800 GMT (grabbed
about 2305 GMT and again at 0105 GMT)
LATEST CHART: TIF file format GIF
file format PNG
file format
Grabbed from: ftp://tgftp.nws.noaa.gov/fax/PPVE89.TIF
(via NWS, USA)
also available from http://weather.noaa.gov/pub/fax/PPVE89.TIF
(via NWS, USA) (except LATEST CHART in GIF & PNG formats which are
converted on-site)
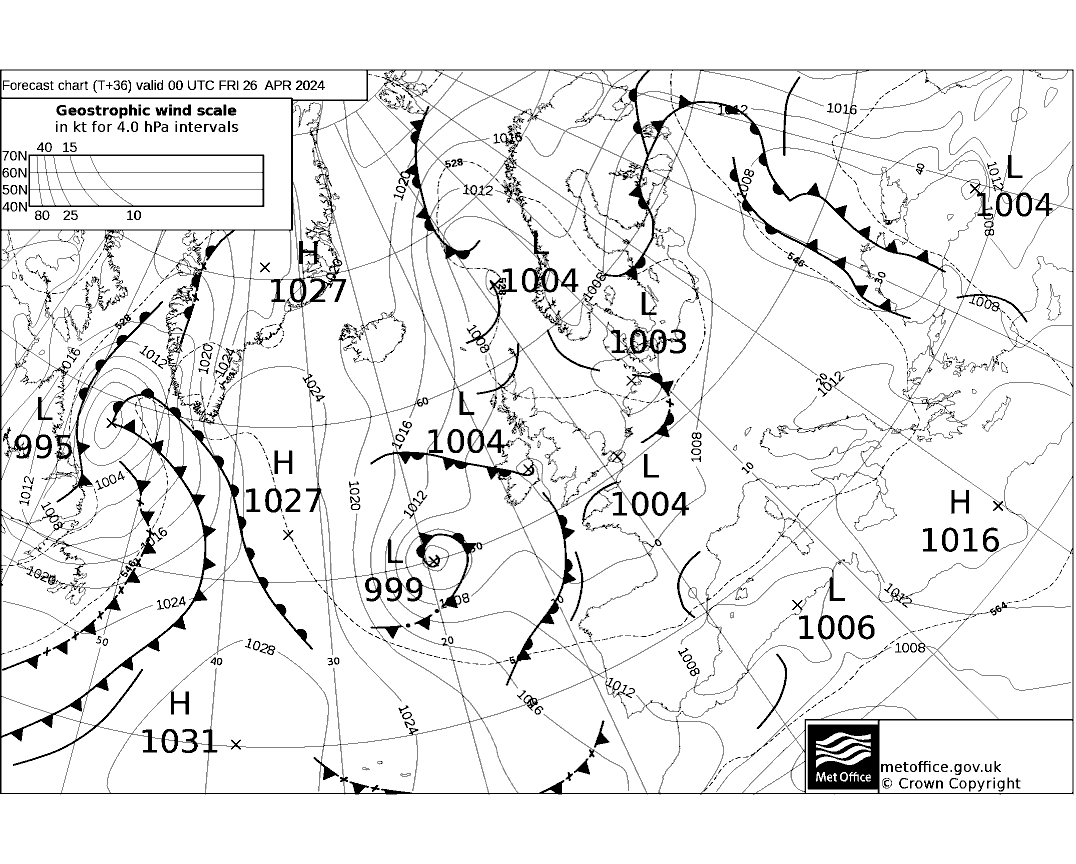
MSLP 36-hour forecast (pressure centres,
fronts, isobars and 1000-500 hPa thickness) (North Atlantic & Europe)
0000 GMT (grabbed about
0605 GMT) 1200 GMT (grabbed
about 1805 GMT)
LATEST CHART: TIF file format GIF
file format PNG
file format
Grabbed from: ftp://tgftp.nws.noaa.gov/fax/PPVG89.TIF
(via NWS, USA)
also available from http://weather.noaa.gov/pub/fax/PPVG89.TIF
(via NWS, USA) (except LATEST CHART in GIF & PNG formats which are
converted on-site)
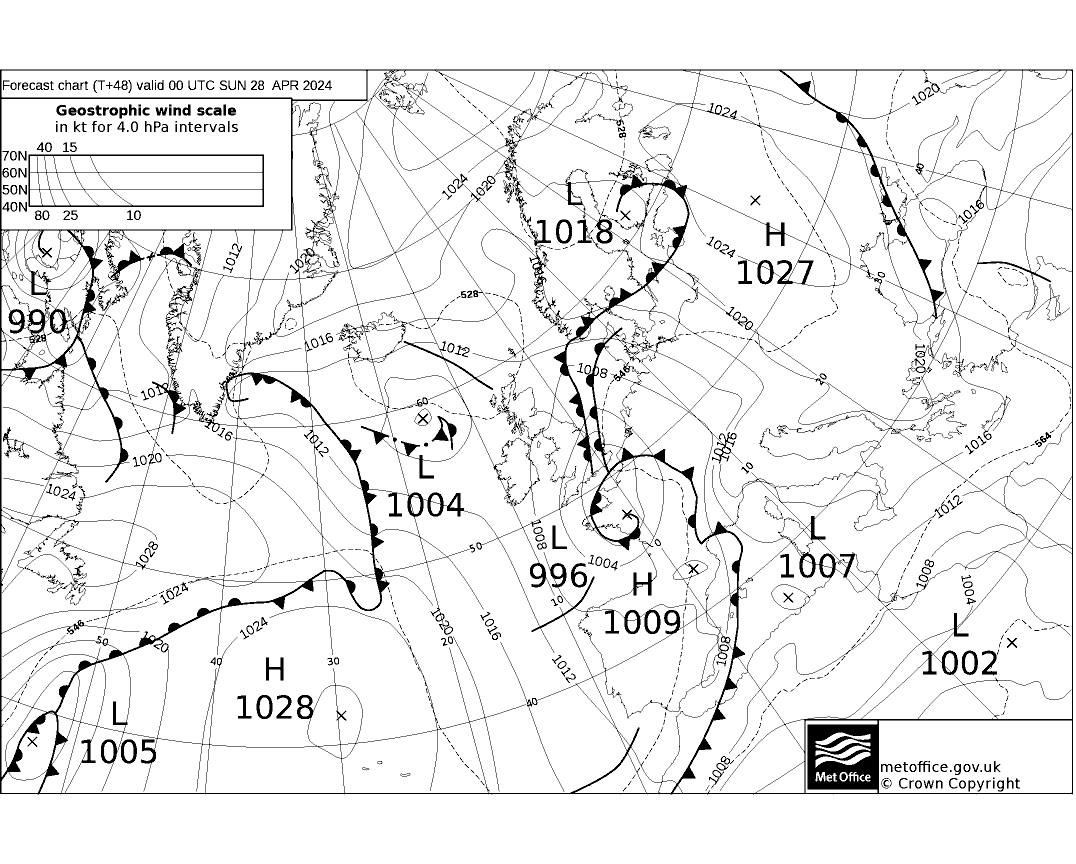
MSLP 48-hour forecast (pressure centres,
fronts, isobars and 1000-500 hPa thickness) (North Atlantic & Europe)
0000 GMT (grabbed about
0605 GMT) 1200 GMT (grabbed
about 1805 GMT)
LATEST CHART: TIF file format GIF
file format PNG
file format
Grabbed from: ftp://tgftp.nws.noaa.gov/fax/PPVI89.TIF
(via NWS, USA)
also available from http://weather.noaa.gov/pub/fax/PPVI89.TIF
(via NWS, USA) (except LATEST CHART in GIF & PNG formats which are
converted on-site)
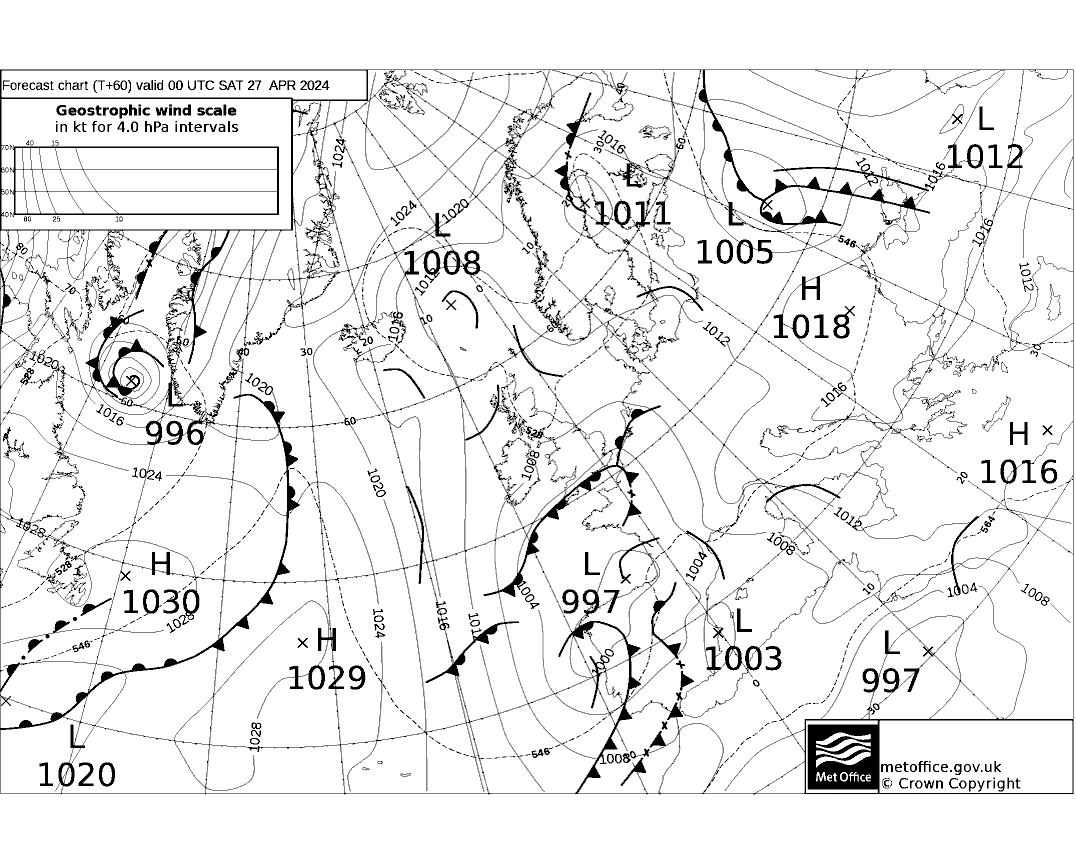
MSLP 60-hour forecast (pressure centres,
fronts, isobars and 1000-500 hPa thickness) (North Atlantic & Europe)
0000 GMT (grabbed about
0705 GMT) 1200 GMT (grabbed
about 1905 GMT)
LATEST CHART: TIF file format GIF
file format PNG
file format
Grabbed from: ftp://tgftp.nws.noaa.gov/fax/PPVJ89.TIF
(via NWS, USA)
also available from http://weather.noaa.gov/pub/fax/PPVJ89.TIF
(via NWS, USA) (except LATEST CHART in GIF & PNG formats which are
converted on-site)
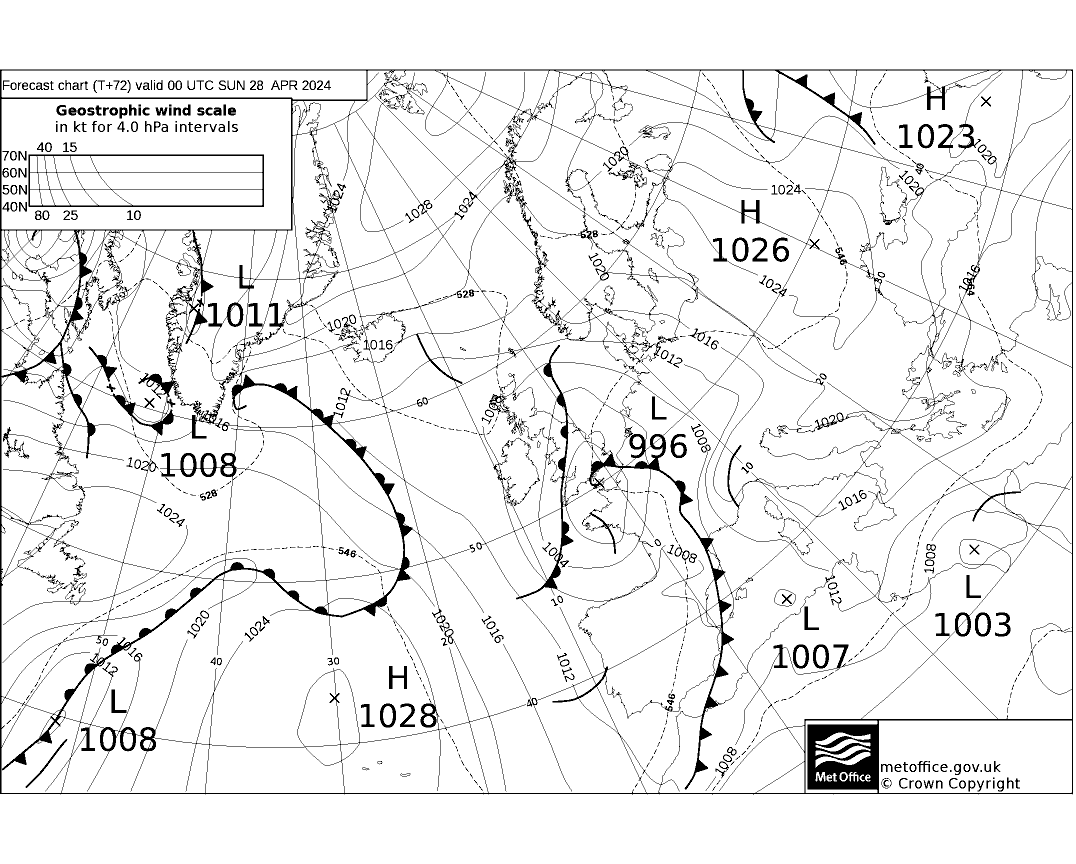
MSLP 72-hour forecast (pressure centres,
fronts, isobars and 1000-500 hPa thickness) (North Atlantic & Europe)
0000 GMT (grabbed about
0705 GMT) 1200 GMT (grabbed
about 1905 GMT)
LATEST CHART: TIF file format GIF
file format PNG
file format
Grabbed from: ftp://tgftp.nws.noaa.gov/fax/PPVK89.TIF
(via NWS, USA)
also available from http://weather.noaa.gov/pub/fax/PPVK89.TIF
(via NWS, USA) (except LATEST CHART in GIF & PNG formats which are
converted on-site)
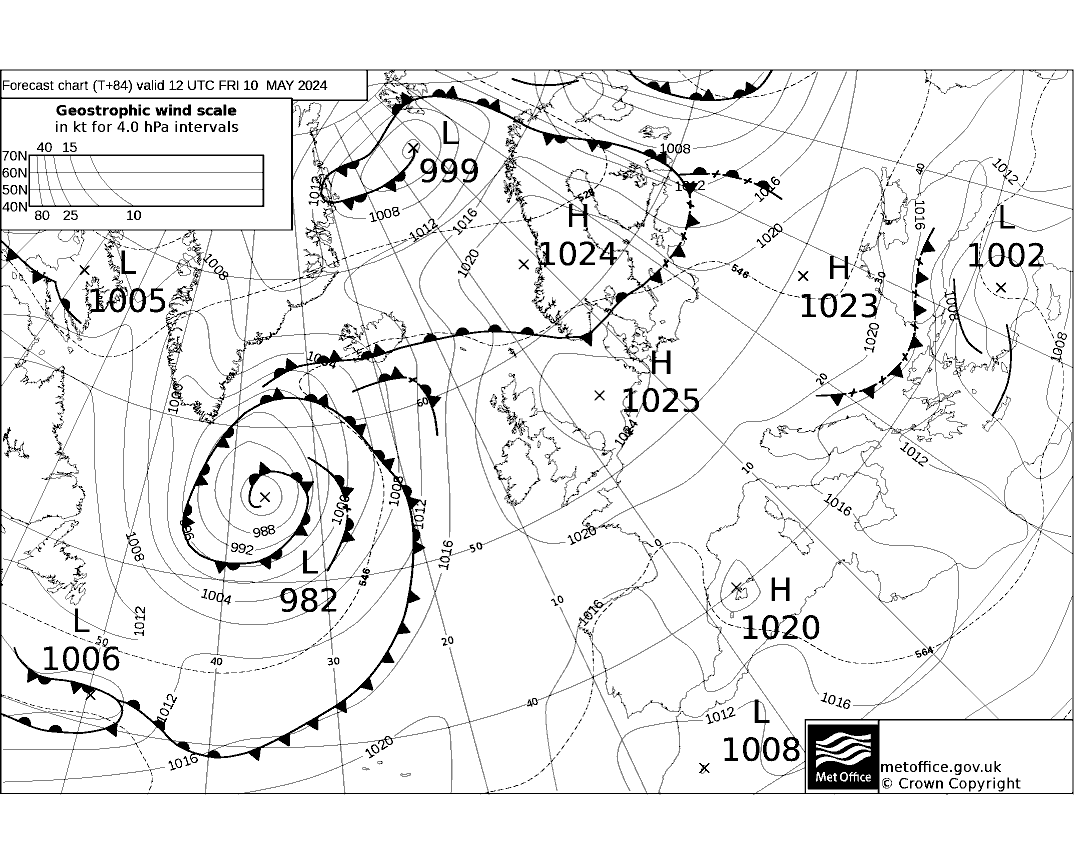
MSLP 84-hour forecast (pressure centres,
fronts, isobars and 1000-500 hPa thickness) (North Atlantic & Europe)
0000 GMT (grabbed about 0905
GMT)
LATEST CHART: TIF file format GIF
file format PNG
file format
Grabbed from: ftp://tgftp.nws.noaa.gov/fax/PPVL89.TIF
(via NWS, USA)
also available from http://weather.noaa.gov/pub/fax/PPVL89.TIF
(via NWS, USA) (except LATEST CHART in GIF & PNG formats which are
converted on-site)
MSLP 96-hour forecast (pressure centres, fronts, isobars and 1000-500 hPa
thickness) (North Atlantic & Europe)
1200 GMT (grabbed about
2305 GMT)
LATEST CHART: TIF file format GIF
file format PNG
file format
Grabbed from: ftp://tgftp.nws.noaa.gov/fax/PPVM89.TIF
(via NWS, USA)
also available from http://weather.noaa.gov/pub/fax/PPVM89.TIF
(via NWS, USA) (except LATEST CHART in GIF & PNG formats which are
converted on-site)
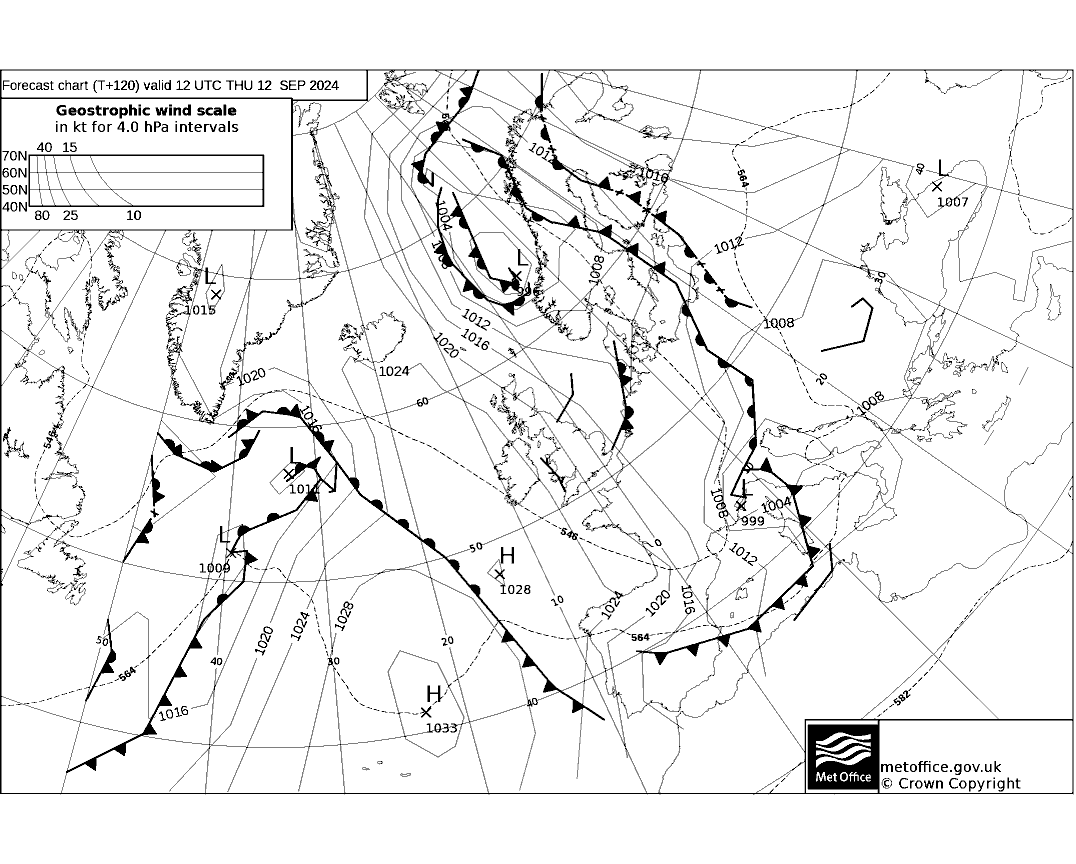
MSLP 120-hour forecast (pressure centres,
fronts, isobars and 1000-500 hPa thickness) (North Atlantic & Europe)
1200
GMT (grabbed about 2305 GMT)
LATEST CHART: TIF
file format GIF
file format PNG
file format
Grabbed from: ftp://tgftp.nws.noaa.gov/fax/PPVO89.TIF
(via NWS, USA)
also available from http://weather.noaa.gov/pub/fax/PPVO89.TIF
(via NWS, USA) (except LATEST CHART in GIF & PNG formats which are
converted on-site)
North Atlantic Sea State forecast from the Met Office
Wave height, swell direction & wind direction (Files in .TIF
format): T+24, T+48
(via NWS, USA)
Table 1 – Approximate guide times (UTC) re the availability
of latest charts on the NWS servers
But always check the validity time on the chart downloaded
|
|
|
|
|
|
|
|
|
|
|
|
|
|
|
|
|
|
|
|
|
|
|
|
|
|
|
|
|
|
|
|
|
|
|
|
|
|
|
|
|
|
|
|
|
|
|
|
|
|
|
|
|
|
|
Table 2 – Latest charts on the NWS http server
|
|
available via http://weather.noaa.gov/pub/fax/~....... (all charts are in .tif format) |
||||||||
|
|
|
|
|
|
|
|
|
|
|
|
|
|
|
|
||||||
|
|
|
|
|
|
|
|
|
|
|
|
|
|
|
|
||||||
|
|
|||||||||
DT Analyses and MSLP forecasts produced produced by the NMC Met Office, Exeter
available via ftp://tgftp.nws.noaa.gov/fax/~....... (all charts are in .tif format)00Z Analysis T+24 T+36 T+48 T+60 T+72 T+84 – – 06Z Analysis T+24 12Z Analysis T+24 T+36 T+48 T+60 T+72 T+96 T+120 – 18Z Analysis T+24 Sea-surface temperatures NE Atlantic and UK Waters (Chart PTUK21)
North Atlantic Sea State forecast and Sea Surface temperature analyses from the Met Office
Wave height, swell direction & wind direction/Sea surface temperatures around the UK and the NE Atlantic
(Files are in TIF format via NWS, USA – see below for a link to this chart via the Weather Online site)
24-hour forecast 48-hour forecast Met Office Sea Surface temperature
(http server)Met Office Sea Surface temperature
(ftp server)Analyses and forecast products direct from the Met Office
(ONE set of charts daily based on 0000UTC data time and available soon after 0730UTC)
MSL analysis for 0000UTC and forecast MSL products out to T+84
|
|
|
|
|
|
|
|
|
|
|
|
|
|
|
|
|
|
|
|
|
|
The Metbrief site has links for the current
MSLP analysis and forecast charts issued by the Met Office
and in particular has a rolling 24-hour set of analyses (ASXX)
on one page
|
|
UK Met Office MSLP analyses and forecast
products
via the Weather Online site
The Weather Online site has links for all the
MSLP forecast charts issued by the Met Office
SEA TEMPERATURES for the NE Atlantic and UK waters issued by the Met
Office
is also available via this site – Left-hand side menu bar, bottom link
The Sea temperature charts can also be accessed via the HTTP and FTP servers
in Washington
(seeTables 2 and 3 below for the links)
|
|
Global
Model output from the Met Office
Wyoming University
The link below allows the user to select the form of presentation
of the output. Output from T+0 to T+72 available for different sectors
Menu: UK
Global Model output
Meteocentre Site
Two sets of charts are available, MSLP isobaric output (4-mb
spacing) plus 500-hPa contours and the key total thickness of the 1000/500-hPa
layer (in the standard colours used by the Met Office (Brown - 510 dam, Blue
- 528 dam, Green - 546 dam, Red - 564 dam, Purple - 582 dam). The Models
Menu page on the site provides a wide choice of presentations. The links
below provide access to all the pages available.
|
|
|
The European Theater Source for Weather Information
The site has been completely redesigned and went live on
5th February 2007.
The following links are to some of the products but the full set of products
may be accessed via the Home page
The following links are to products on the public access
part of the site maintained by theUnited States Airforce in Europe
The forecast products are based on the global model output from the Met Office
|
|
|||
|
|
|
|
|
|
|
|
|
|
|
|
|
|
|