|
|
available via http://weather.noaa.gov/pub/fax/~....... (all in tiff format) |
||||||||
|
|
|
|
|
|
|
|
|
|
|
|
|
|
|
|
||||||
|
|
|
|
|
|
|
|
|
|
|
|
|
|
|
|
||||||
Note:
Latest analyses usually available by HH+3, and the 24-hour forecast by HH+4
the T+36/T+48 usually available by HH+5, the T+72/84 by HH+8
and the T+96/120 by HH+11
But always check the validity time on the chart.
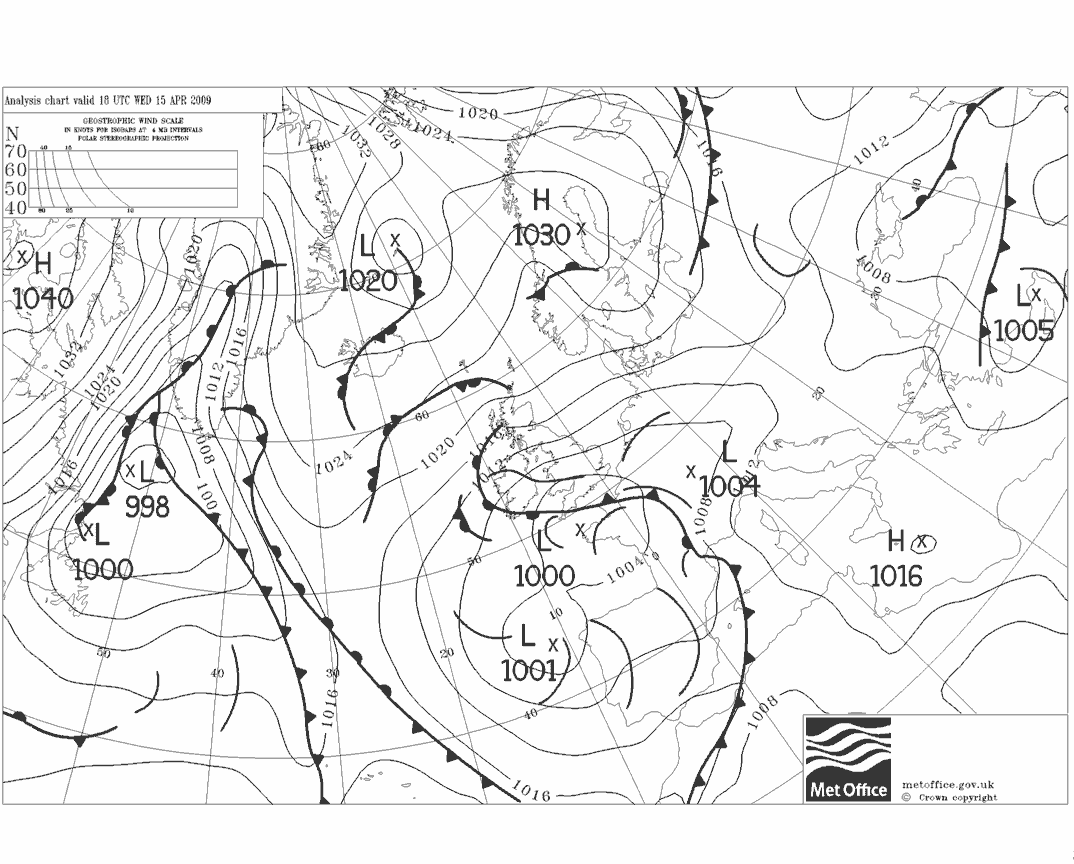
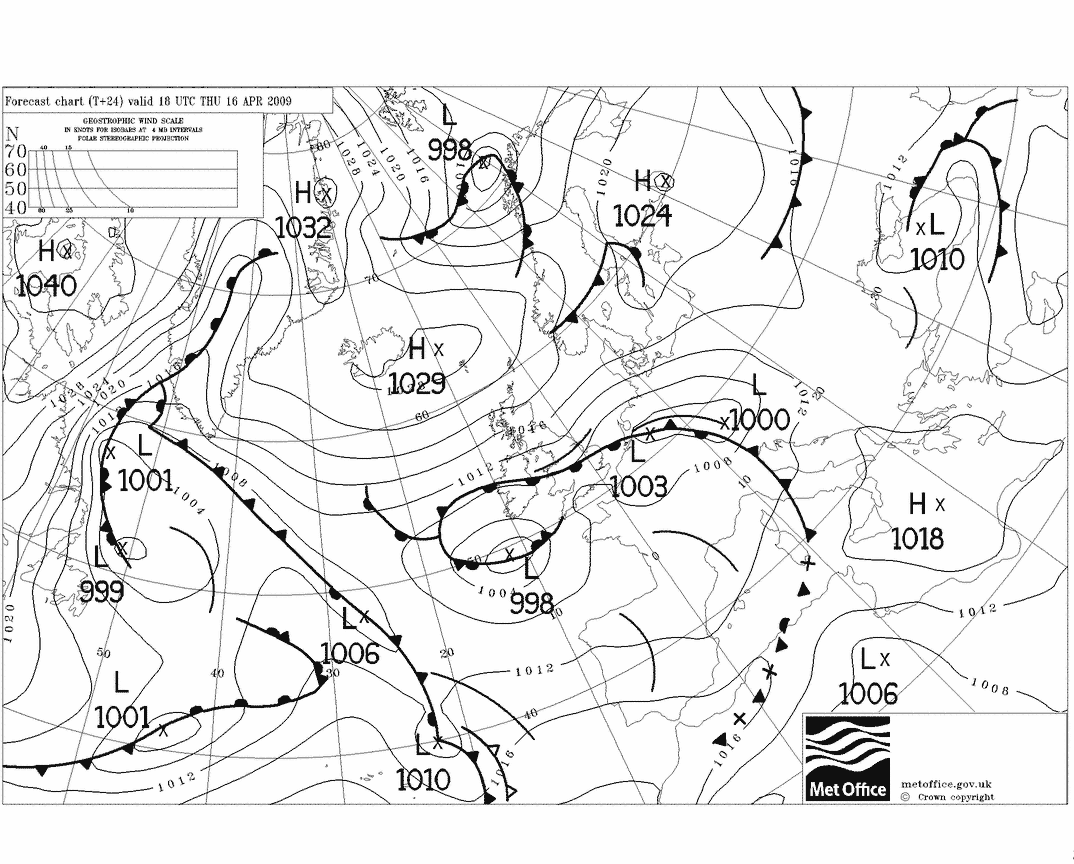
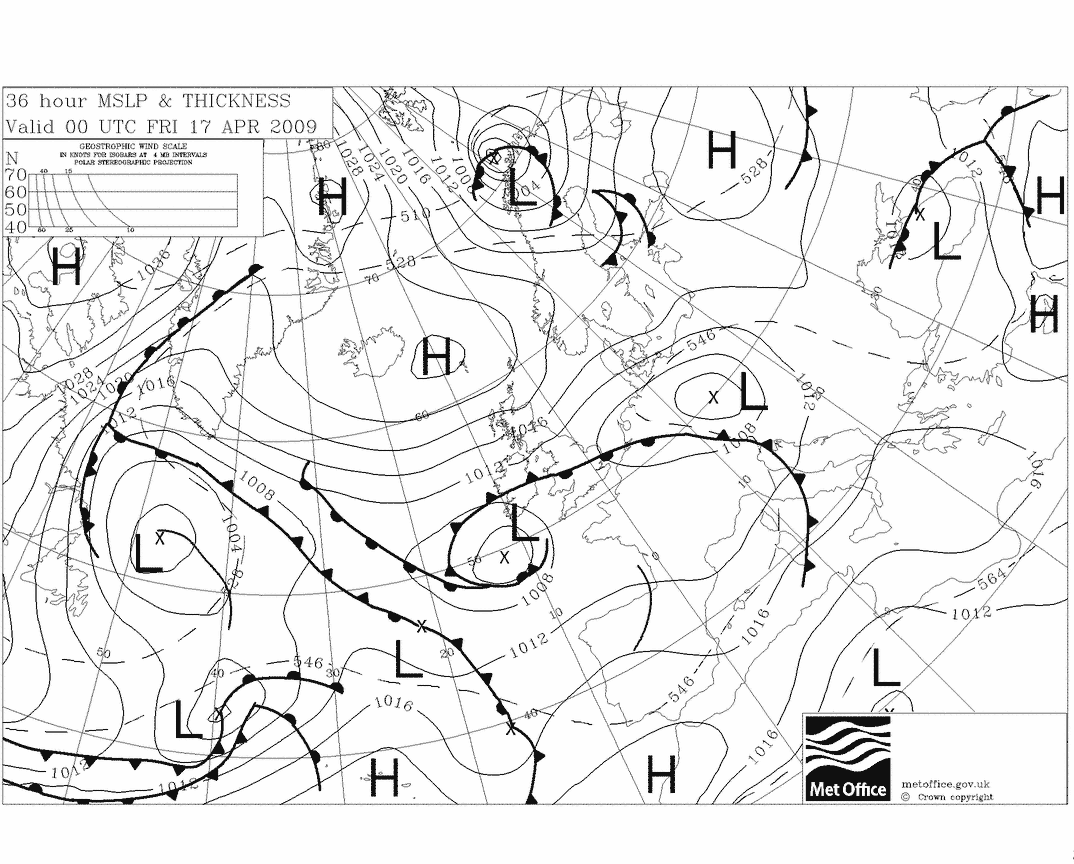
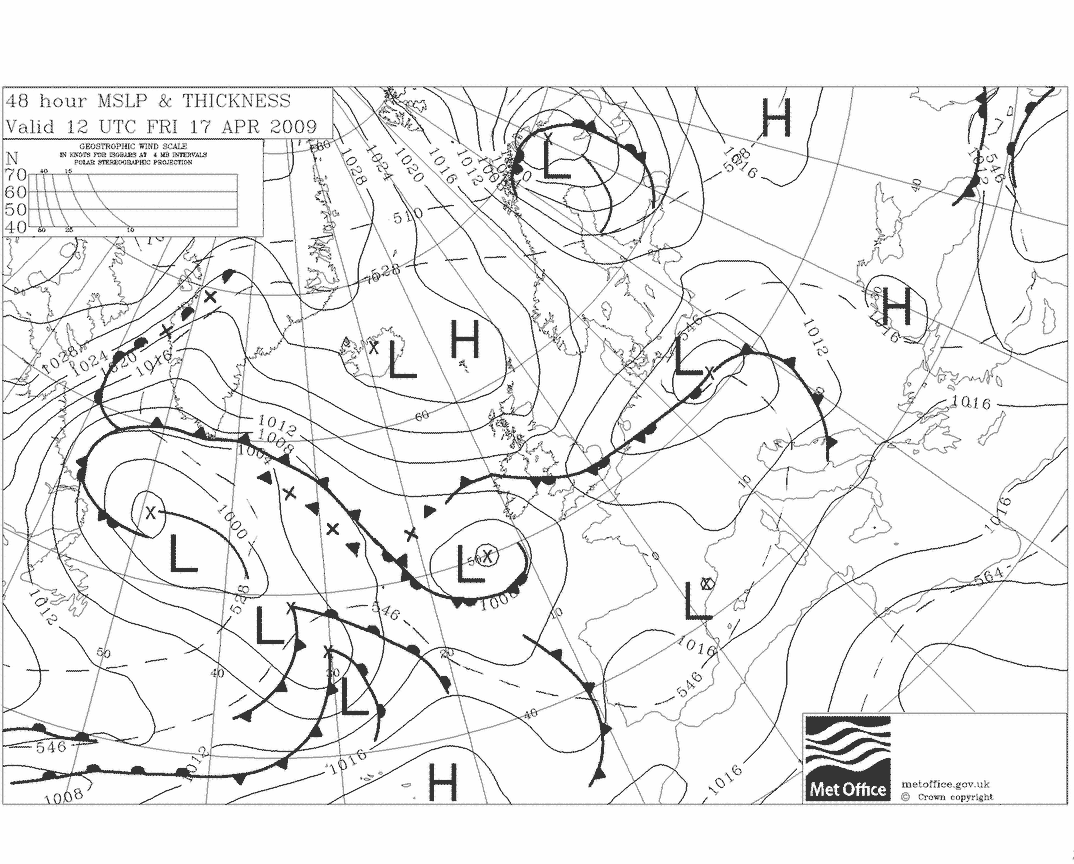
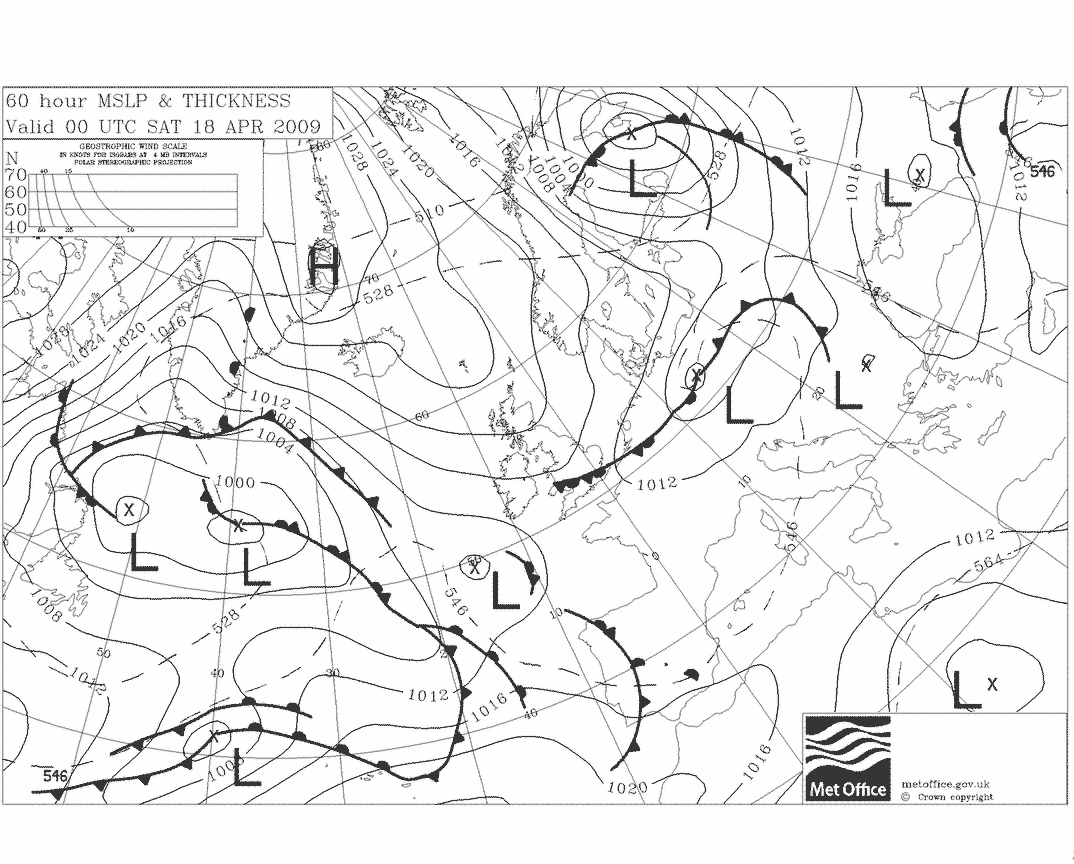
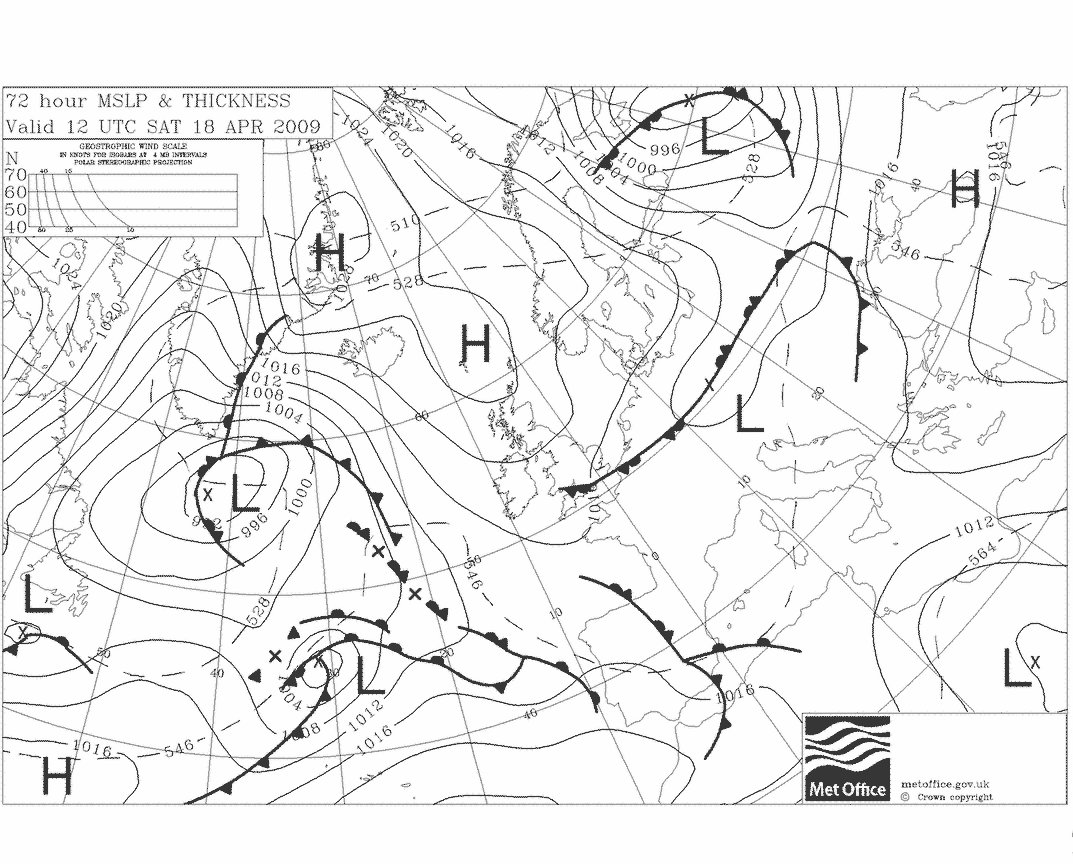
UK Met Office Exeter – Analyses and Forecast MSLP Charts
The forecaster adjusted analyses and forecast surface charts issued by the Met Office in the UK are available via the UK Wx Inf server or direct via the NWS http server (see table above). Charts on the NWS servers are the latest received on the GTS. The UK Weather Information site converts the charts to 'gif' and 'png' format and again hosts the lastest issues of the charts. The site also maintains a rolling 24 hours of the charts in 'tif' format. Please note that the charts on the UK Weather Information site are grabbed from the NWS servers at specific times. Therefore there will be occasions when there has been a delay in the chart arriving on the NWS server and accordingly the chart is a previous issue - so always check the date and the time.
The charts are also available via FTP e-mail courtesy of the NWS in Washington. If accessing these products in the marine environment the products are some 80kB which are quite large files for access via satellite communication services.
For charts via USAFE Sembach click here. Charts on the Sembach server (pressure and ppn) are based on the UK Met Office Model.
The UK Met Office charts are also available via several other sites including the Wetter3 web site (links to individual charts may be found on the models page of this site).
|
|
|
||||||
|
|
Latest chart available |
|
|
|
|||
|
|
|
|
|
|
|
|
|
|
|
|
|
|
|
|
|
|
|
|
|
|
|
|
|
|
|
|
|
|
|
|
|
|
|
|
|
|
|
|
|
|
|
|
|
|
|
|
|
|
|
|
|
|
|
|
|
|
|
|
|
|
|
|
|
|
|
|
|
|
|
|
|
|
|
|
|
|
|
|
|